
Robotic process automation ROI should not be based on a vague claim that bots save time. It should show exactly how much labor capacity was released, how many errors were prevented, how transaction costs changed, where employees redirected their time, and when the investment paid for itself.
One widely repeated benchmark comes from Automation Any where’s 2021 Now & Next: State of RPA report. It reported an average RPA ROI of 250%, with top-performing organizations averaging 380%. A related Automation Anywhere ROI guide says deployments typically paid back within six to nine months. These are vendor-reported, historical benchmarks, and not guaranteed outcomes for every implementation. They are most useful as comparison points after your own baseline and production data have been measured.
A separate 2022 Deloitte intelligent automation survey found that organizations operating beyond the pilot stage reported an average cost reduction of 32%. Cost reduction is not the same as ROI, but it provides another useful reference point when evaluating whether an automation program is producing measurable operating value.
This guide explains the five metrics needed to calculate a defensible robotic process automation ROI and turn it into a business case finance and operations leaders can review.
What the 250% RPA ROI Benchmark Does and Does Not Prove
The 250% average and 380% top-performer figures are verified against Automation Anywhere’s Now & Next: State of RPA report. However, the report is vendor-produced and dates to 2021. It should be described as a historical vendor benchmark rather than a current universal standard.
It also does not tell you whether your specific robotic process automation deployment is succeeding. ROI varies according to process volume, manual handling time, exception rate, labour cost, implementation cost, software licensing, maintenance, and the value created from the capacity released.
The standard RPA ROI formula is:
RPA ROI (%) = [(Total Benefits – Total Cost of Ownership) / Total Cost of Ownership] x 100
The payback-period formula:
Payback period in months = Total implementation cost / Average net monthly savings
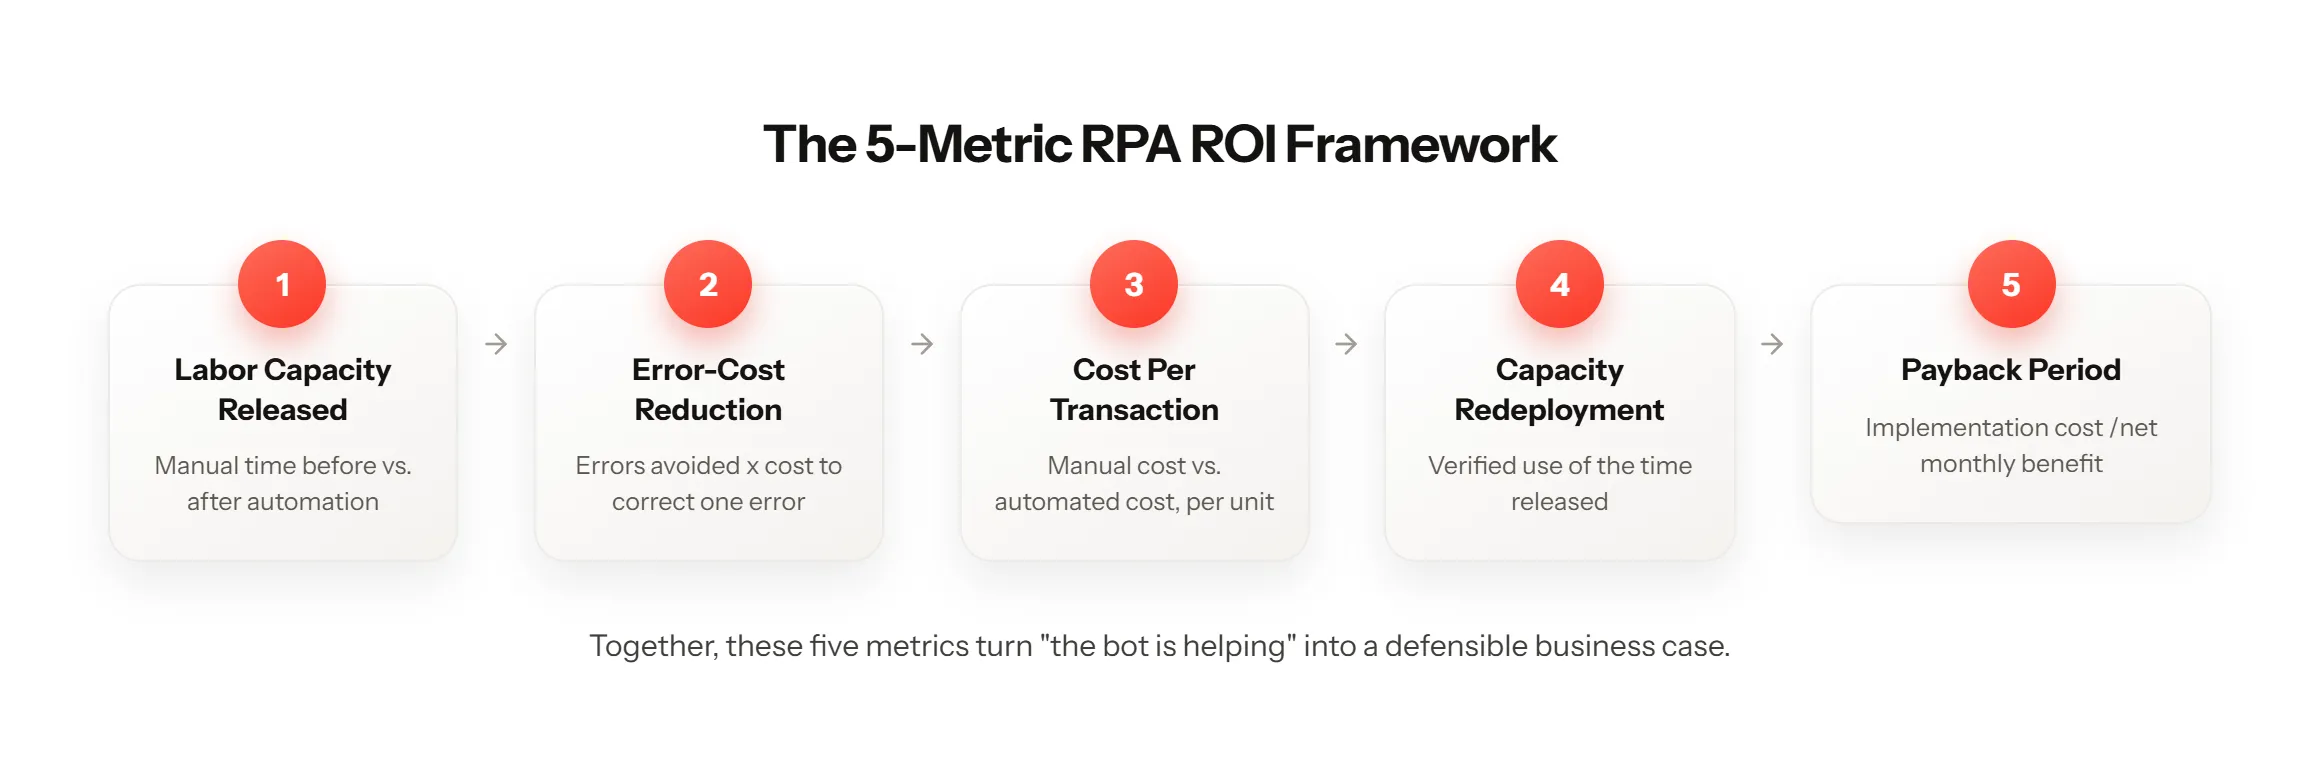
Those formulas are simple. The difficult part is making sure the inputs are measured, complete, and not inflated. The following five metrics provide those inputs.
| Metric | What to measure | Why it matters |
| Labor capacity released | Manual time before automation versus human time after automation | Quantifies productive time returned to the business |
| Error-cost reduction | Errors before and after automation, multiplied by correction cost | Captures avoided rework and downstream loss |
| Cost per transaction | Total process cost divided by completed transaction volume | Shows whether unit economics improved |
| Capacity redeployment | Verified use of the time release | Prevents theoretical time savings from being counted as realized value |
| Payback period | Implementation cost divided by net monthly benefit | Shows when the investment becomes financially positive |
1. Measure Labor Capacity Released by Automation
The first metric is not simply how long the bot runs. It is how much human processing time the automation removes from the workflow.
Use this formula:
Annual hours released = (Manual minutes per transaction – Human minutes after automation) x Annual transaction volume / 60
For example, assume a repetitive task previously required five minutes of employee time and ran 40,000 times per year. If automation removes the full five minutes of manual handling, the calculation is:
5 minutes x 40,000 transactions / 60 = approximately 3,333 hours released per year
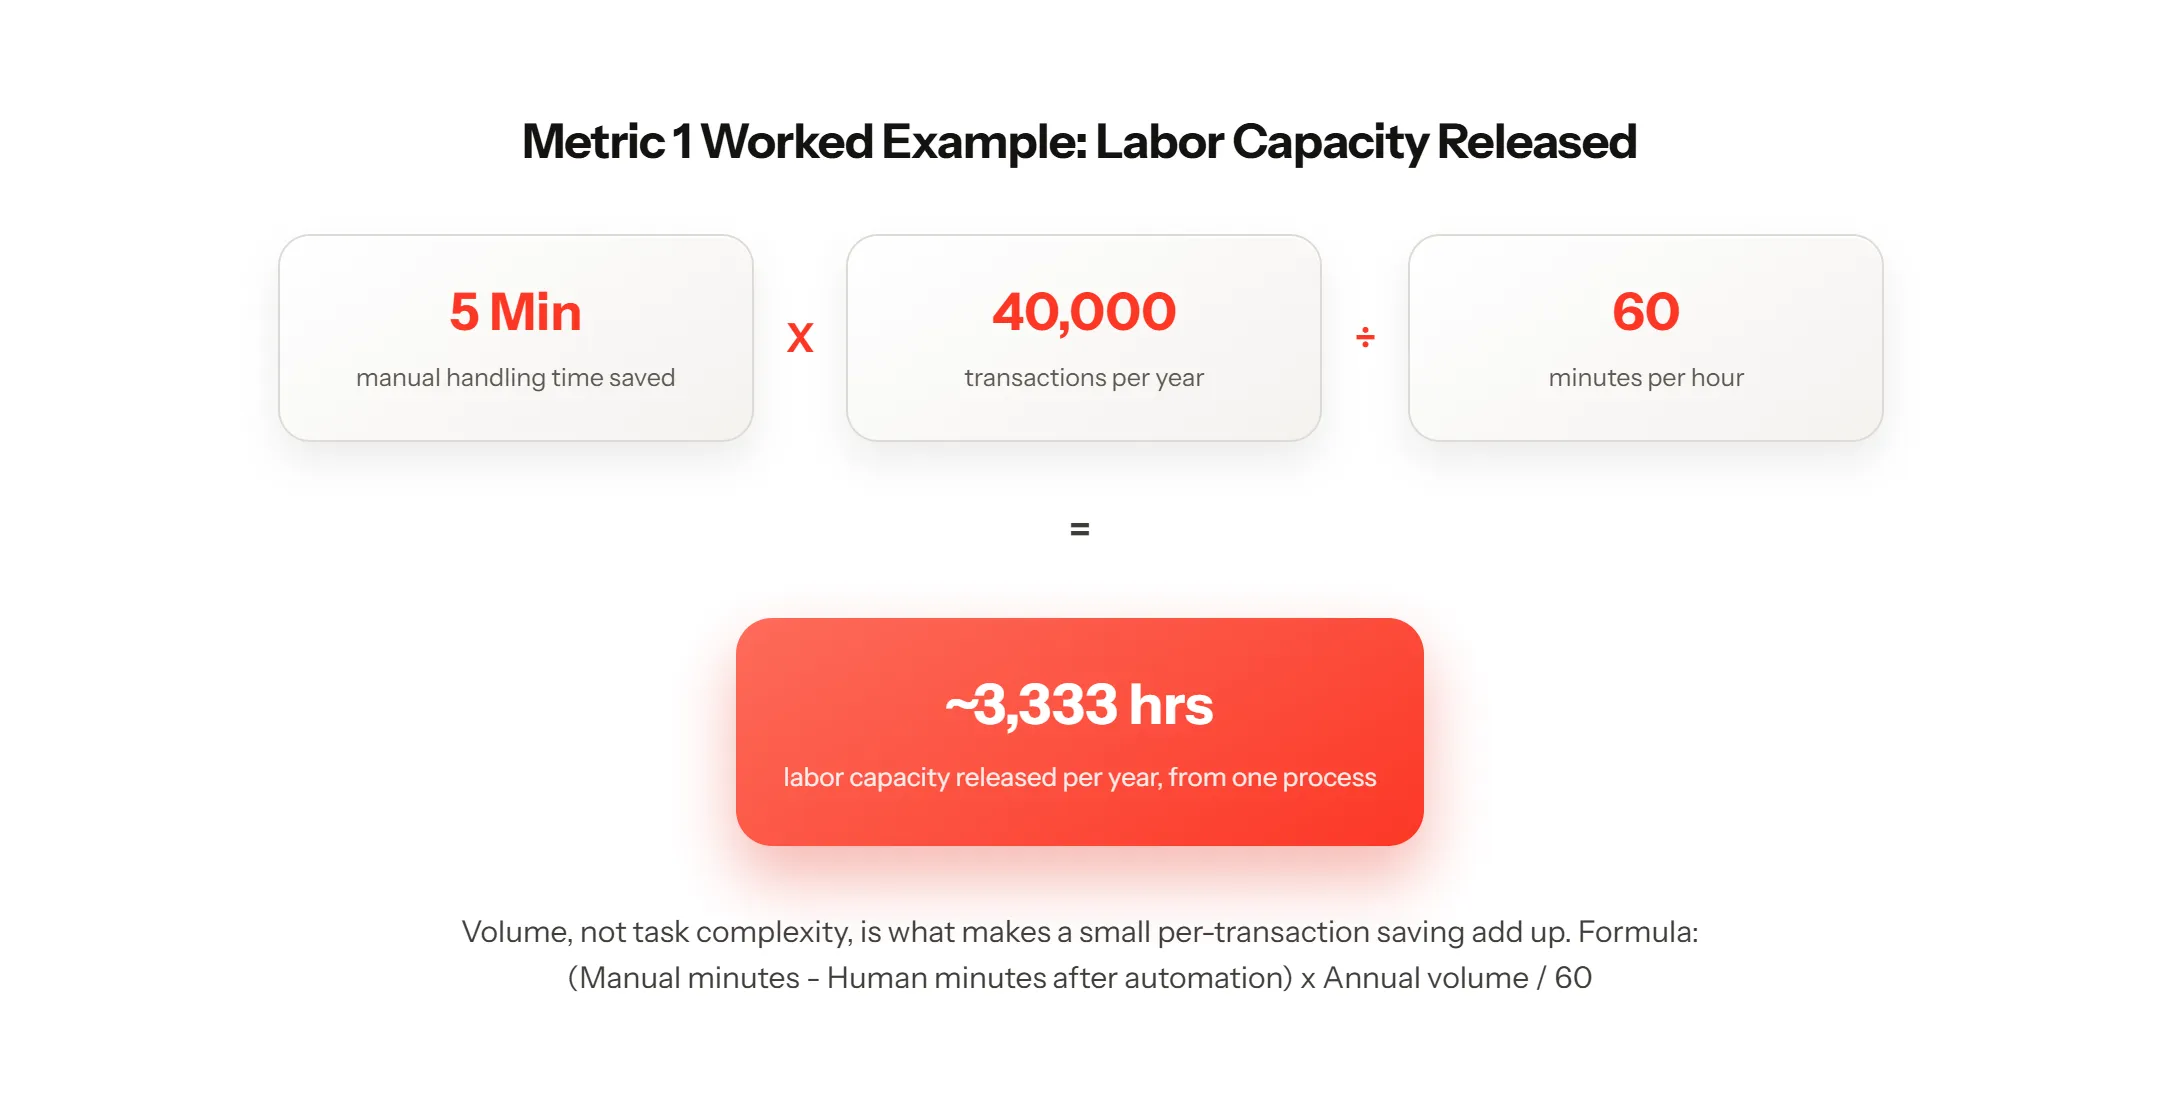
Volume is what makes a small per-transaction saving financially meaningful. This is why business process automation discovery should rank candidate processes by transaction frequency, handling time, consistency, exception rate, and implementation complexity before development begins.
Track at least these inputs:
- Annual transaction volume
- Average manual handling time before automation
- Average human handling time after automation
- Percentage of transactions completed without intervention
- Average fully loaded labor cost per hour
Do not convert every saved hour directly into cash savings unless labor costs were actually reduced. When headcount remains unchanged, the more accurate description is usually labor capacity released.
2. Put a Dollar Value on Fewer Process Errors
A manual process can create costs beyond labor. Errors may lead to rework, duplicate payments, delayed claims, customer service cases, compliance reviews, or missed deadlines.
Use this formula:
Annual error savings = (Annual errors before automation – Annual errors after automation) x Average cost to correct one error
The baseline must come from actual process records. If no error log exists, review a representative sample before implementation and document the sampling period, transaction count, and definition of an error.
The cost of an error should include more than the minutes required to correct the original entry. Depending on the process, it may include:
- Rework by the original employee
- Review by a manager or specialist
- Customer support or vendor communication
- Processing delays
- Duplicate or incorrect payments
- Compliance investigation or audit preparation
Avoid assigning speculative dollar values to reputational damage or employee frustration unless the organization already uses an approved financial model for those effects. Keep hard savings and softer benefits separate.
3. Calculate the True Cost per Automated Transaction
Hours saved show operational impact. Cost per transaction shows whether the economics of the process improved.
Calculate the manual baseline first:
Manual cost per transaction = Total annual manual process cost / Annual completed transactions
Then calculate the automated figure:
Automated cost per transaction = Total annualized automation cost / Annual completed transactions
A complete calculation may include:
- Software and bot licenses
- Discovery and process-mapping work
- Development and configuration
- Testing and quality assurance
- Infrastructure or hosted runtime costs
- System integration work
- Monitoring and support
- Maintenance after application or interface changes
- Governance, security, and compliance controls
- Human exception handling
This metric also reveals weak automation candidates. A low-volume process with inexpensive manual handling may operate flawlessly after automation while still producing a poor financial return. A high-volume process with significant manual effort may create a much stronger result.
4. Prove Where the Saved Employee Capacity Went
Released time does not automatically become realized financial value. The organization must show what employees did with the capacity created by automation.
Examples of measurable redeployment include:
- Clearing a documented backlog
- Increasing transaction throughput without adding headcount
- Shortening response or processing times
- Moving employees to analysis, review, or customer-facing work
- Handling exceptions that require judgment
- Reducing overtime or temporary staffing
- Avoiding a planned hire as volume grows
This is where AI workflow automation and human-in-the-loop design become important. Routine, rules-based work can be automated, while uncertain or high-risk cases are routed to a person with the relevant context.
Pendoah’s Worklighter case study provides a concrete example. The case study reports that 90% of invoices are auto processed. It also states that 10% to 20% of documents are routed for human decisions through an exception-only review queue.
These figures refer to different scopes, invoices versus documents, so they should not be presented as two sides of the same percentage calculation. The ROI value comes from what the office team can now accomplish with exception-only review, not simply from the fact that the automated system is running.
5. Use Production Data to Calculate the Payback Period
The payback period answers a direct financial question. How many months will it take for net benefits to recover the initial investment?
Use this formula:
Payback period in months = Total implementation cost / Average net monthly benefit
Net monthly benefit should include verified labor value, avoided error costs, and other approved financial gains, minus recurring monthly costs.
A published Automation Anywhere invoice-processing example uses the following illustrative inputs:
- One-time implementation cost: $60,000
- Annual software licensing and maintenance: $25,000
- Annual hard labor savings: $130,000
- Year 1 total cost of ownership: $85,000
The resulting calculations are 53% ROI in Year 1 and an approximately 7.8-month payback period. These figures are externally verifiable as a vendor-published worked example, but they are not customer results or a universal benchmark.
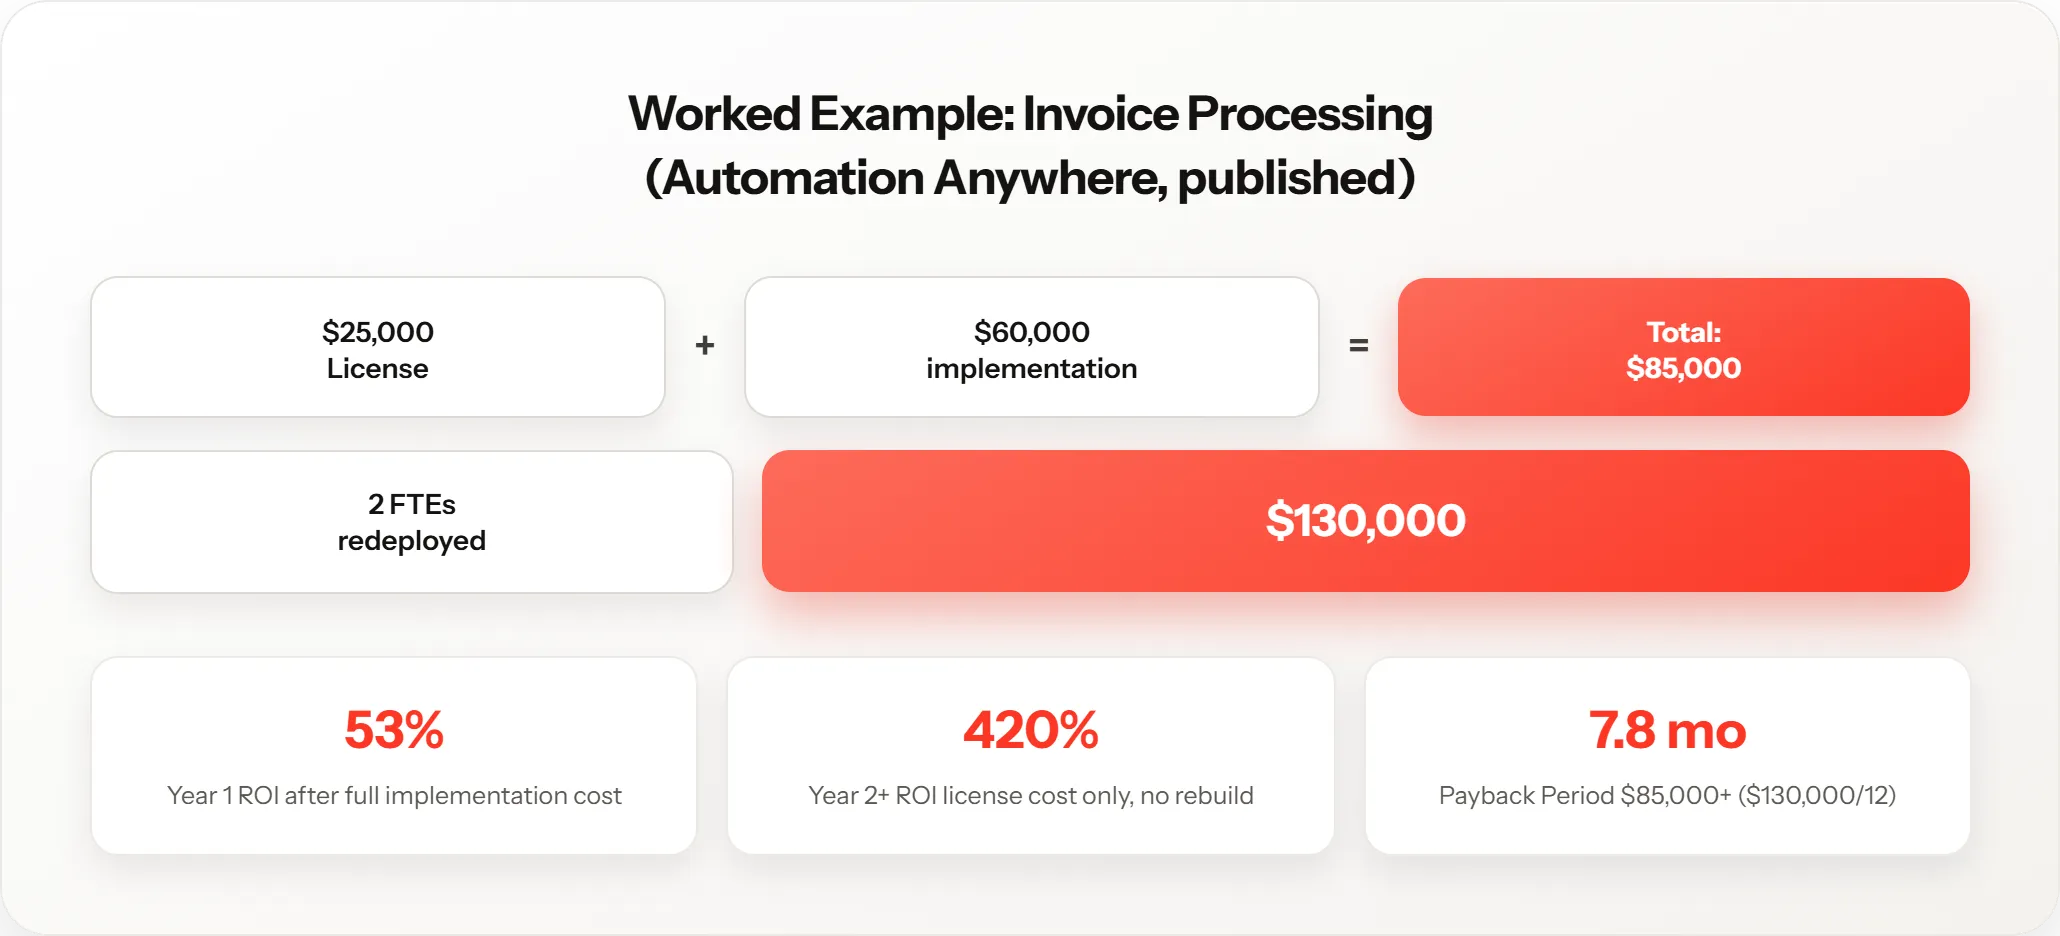
Calculate an initial projection before implementation, then replace projected inputs with production measurements after the automation has operated long enough to capture normal volume and exception patterns.
Build a CFO-Ready RPA Business Case
A credible business case connects the five metrics instead of presenting a single productivity claim.
Use publicly documented results only when presenting a real-world example. Pendoah’s Worklighter case study reports that 90% of invoices are auto-processed and that only exception cases require human review. The case study does not publish implementation cost, monthly savings, or a payback period, so those figures should not be added without client-approved production data.
For an internal business case, summarize only the figures supported by the organization’s own baseline and production records. Place the assumptions directly below the summary, including transaction volume, measurement period, labor rate, error baseline, correction cost, implementation cost, recurring cost, and expected exception rate.
The business case should also explain why this process was selected. Pendoah’s AI automation services begin with mapping operational workflows and identifying the automation opportunities most likely to create measurable value. This prevents the team from choosing a process because it looks impressive rather than because its volume, cost, and consistency support a return.
Include Every Cost That Can Reduce RPA ROI
There is no responsible universal price for robotic process automation. Cost depends on the process, systems involved, transaction volume, exception complexity, security requirements, and operating model.
The initial build is only one part of the investment. A defensible total-cost model should include:
- Process discovery and documentation
- Automation platform or bot licensing
- Development and testing
- Integration with existing applications
- Infrastructure and environment setup
- Security and access controls
- Monitoring and incident response
- Maintenance after system changes
- Change management and training
- Governance and audit requirements
- Human review of exceptions
Maintenance deserves particular attention. Interface changes, authentication updates, workflow changes, and new exception types can all affect production performance. Excluding these costs can make an ROI projection look stronger than the operating reality.
Pressure-Test the ROI Before You Present It
Before presenting the number to leadership, test whether it still holds under less favorable conditions.
Ask:
- Is the calculation based on measured data or assumptions?
- Does total cost include licensing, infrastructure, implementation, monitoring, and maintenance?
- Are saved hours being counted as cash savings even though payroll remains unchanged?
- Is the baseline based on a representative period?
- Does the model include failed transactions and human exception handling?
- What happens if transaction volume is 20% lower than forecast?
- What happens if maintenance costs are 20% higher than forecast?
- Has the organization documented where released employee capacity will go?
- Are vendor benchmarks clearly labelled as vendor benchmarks?
- Will projected figures be replaced with production measurements after launch?
A sensitivity analysis should show at least a base case, a conservative case, and an optimistic case. This is more credible than presenting one precise number built on uncertain assumptions.
The ROI Is Only Real When the Savings Are Measured
Robotic process automation ROI is not one benchmark copied from a vendor report. It is the combined financial effect of five measured outcomes:
- Labor capacity released
- Error costs avoided
- Cost per transaction reduced
- Employee capacity productively redeployed
- Investment recovered within an acceptable payback period
The strongest automation business cases establish a baseline before development, include the complete cost of ownership, and replace projections with production data after launch.
Need help identifying the processes most likely to produce measurable automation value? Book a consultation with Pendoah or review Pendoah’s AI case studies to see how production automation is measured in real implementations.